Appendix A — Results when optimizing a neural network observable and binning simultaneously
A.1 5-bin observable
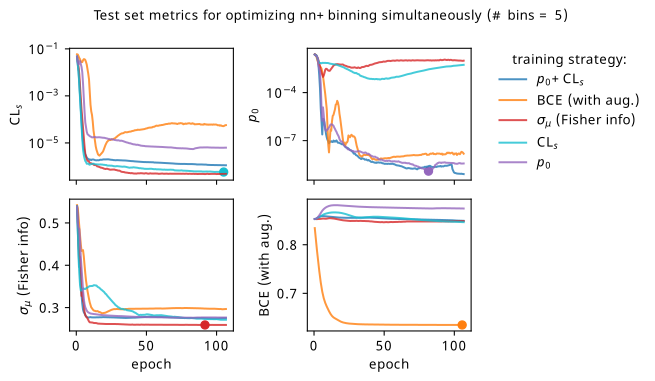
Metrics
Plots of the different metrics calculated on the test set for different training strategies using a 5-bin neural network observable. The results are averaged across 9 random seeds for the weight initializations. The scatter points on some of the curves represent the model that we would select in practice if using that training strategy (provided we decide to use the loss as the selection metric).
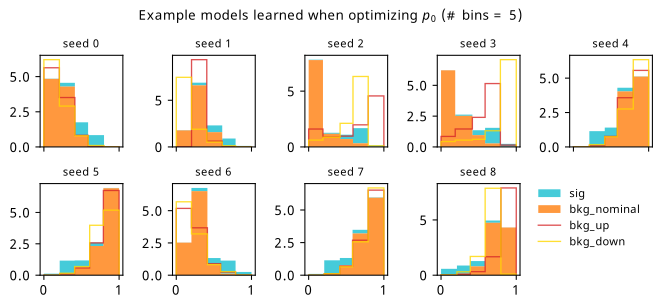
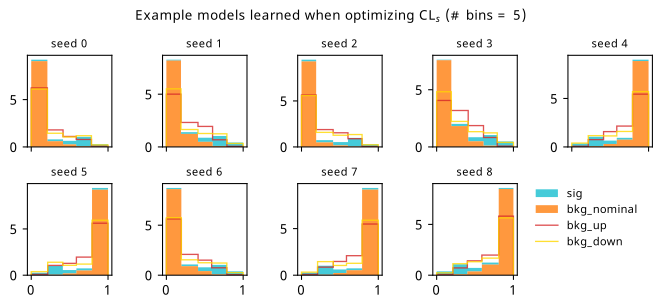
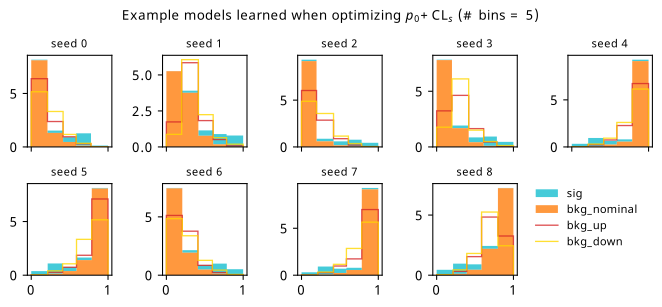
Histograms
Histograms from optimizing with respect to the discovery \(p\)-value \(p_0\).
Histograms from optimizing with respect to the \(\mathrm{CL}_s\).
Histograms from optimizing with respect to a combination of discovery \(p\)-value and \(\mathrm{CL}_s\).
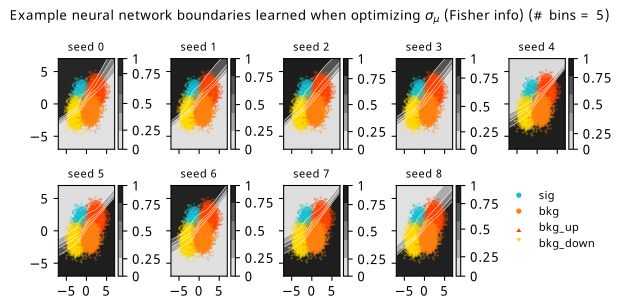
Neural network contours in data space
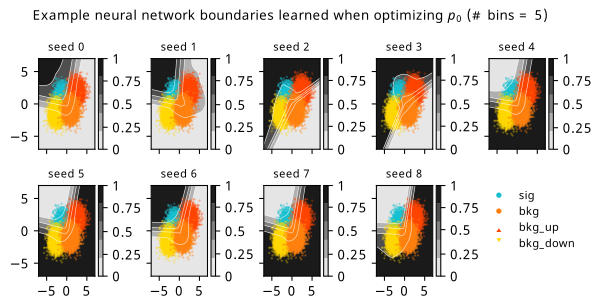
Histograms from optimizing with respect to the discovery \(p\)-value \(p_0\).
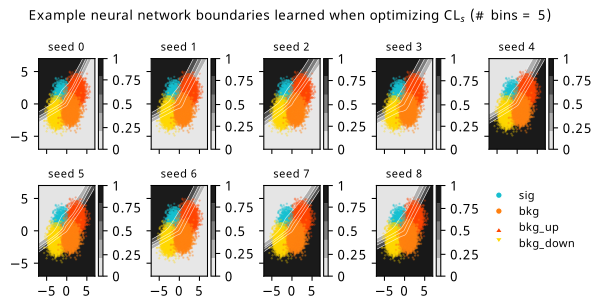
Histograms from optimizing with respect to the \(\mathrm{CL}_s\).
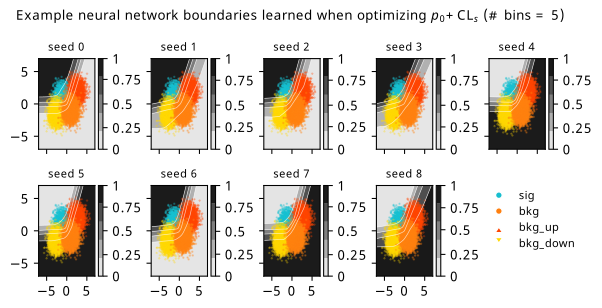
Histograms from optimizing with respect to a combination of discovery \(p\)-value and \(\mathrm{CL}_s\).
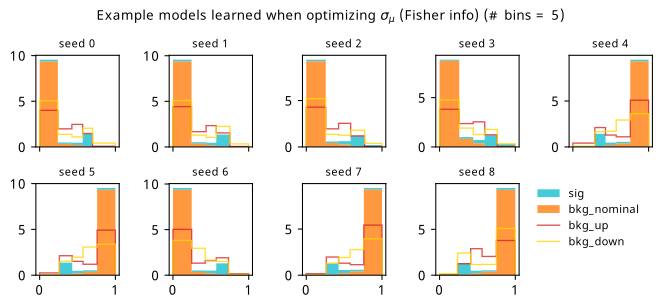
Histograms from optimizing with respect to the Fisher information estimate of \(\sigma_{\hat{\mu}}\).
A.2 20-bin observable
Metrics
Plots of the different metrics calculated on the test set for different training strategies using a 20-bin neural network observable. The results are averaged across 9 random seeds for the weight initializations. The scatter points on some of the curves represent the model that we would select in practice if using that training strategy (provided we decide to use the loss as the selection metric).
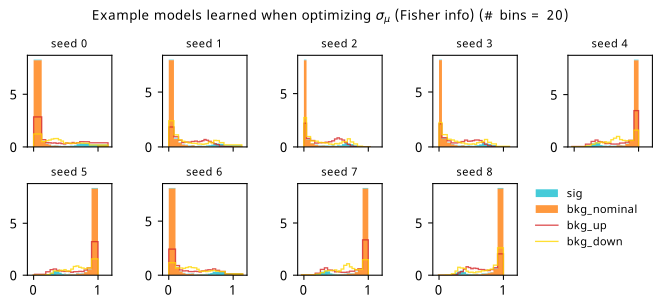
Histograms
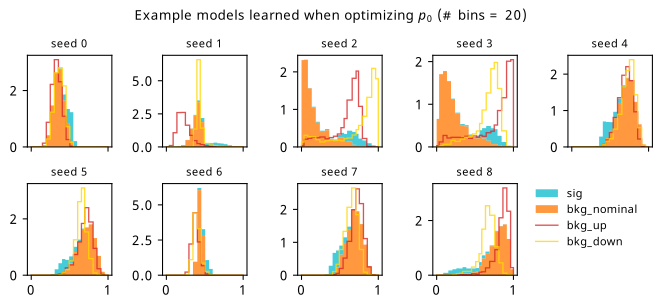
Histograms from optimizing with respect to the discovery \(p\)-value \(p_0\).
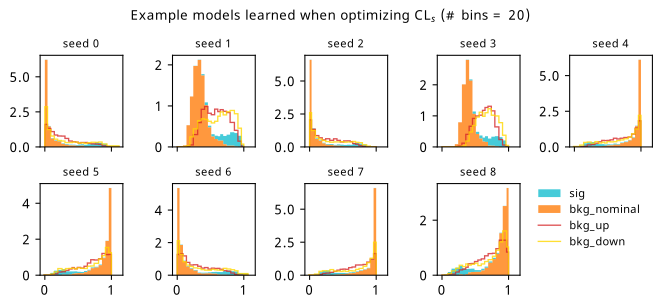
Histograms from optimizing with respect to the \(\mathrm{CL}_s\).
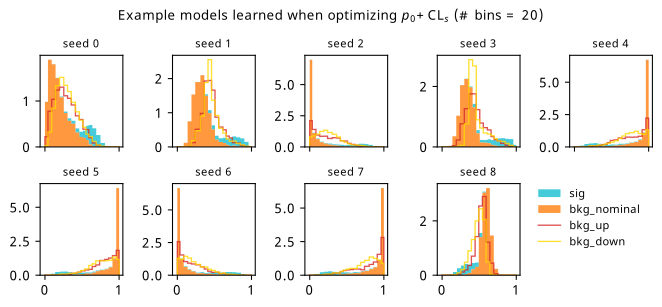
Histograms from optimizing with respect to a combination of discovery \(p\)-value and \(\mathrm{CL}_s\).
Histograms from optimizing with respect to the Fisher information estimate of \(\sigma_{\hat{\mu}}\).
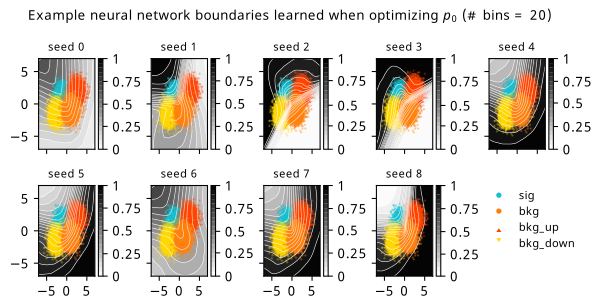
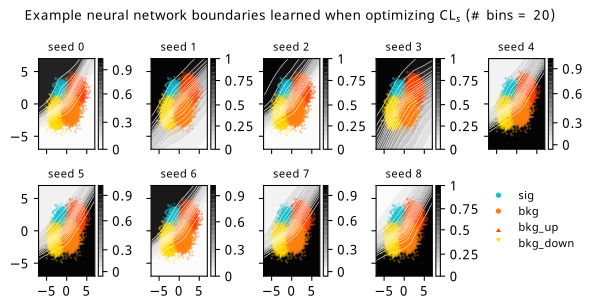
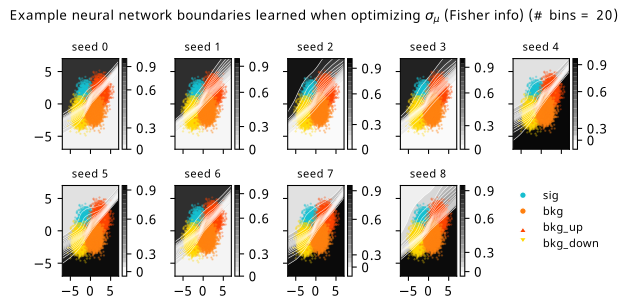
Neural network contours in data space
Histograms from optimizing with respect to the discovery \(p\)-value \(p_0\).
Histograms from optimizing with respect to the \(\mathrm{CL}_s\).
Histograms from optimizing with respect to a combination of discovery \(p\)-value and \(\mathrm{CL}_s\).
Histograms from optimizing with respect to the Fisher information estimate of \(\sigma_{\hat{\mu}}\).